ARTIGO ORIGINAL
Incidence, Mortality and Survival of Pediatric Cancer in Uruguay 2011-2015
Incidência, Mortalidade e Sobrevida por Câncer Infantil no Uruguai, 2011-2015
Incidencia, Mortalidad y Sobrevida del Cáncer Infantil en Uruguay, 2011-2015
https://doi.org/10.32635/2176-9745.RBC.2023v69n1.3054
Fabiana Morosini1; Anaulina Silveira2; Vanessa Arias3; Luis Castillo4
1-4Centro Hospitalario Pereira Rossell, Departamento de Oncología y Hematología. Montevideo, Uruguay.
1E-mail: morosinifa@gmail.com. Orcid iD: https://orcid.org/0000-0002-3864-8967
2E-mail: anaulina.silveira@gmail.com. Orcid iD: https://orcid.org/0000-0003-3296-363X
3E-mail: ynnav_va@hotmail.com. Orcid iD: https://orcid.org/0000-0003-1527-7988
4E-mail: dr.luiscastillo@gmail.com. Orcid iD: https://orcid.org/0000-0003-2880-0838
Corresponding author: Fabiana Morosini. Bvar Artigas 1556. Montevideo, Uruguay. CEP 11200. E-mail: morosinifa@gmail.com
ABSTRACT
Introduction: Childhood cancer is a small proportion of all cancers but is still a major public health problem. Objective: To describe the 5-year incidence and mortality rates and net survival of childhood cancer in Uruguay. Method: Data on all malignant tumors diagnosed in children aged 0-14 were included for the period 2011-2015, obtained from the National Pediatric Registry of Cancer and from the Ministry of Health Mortality Registry, classified according to the International Classification of Childhood Cancer (ICCC-3). Information on the total population was obtained from national census records. Follow up was made until December 2020. Results: The standardized incidence rate was 128/million children per year. The distribution of the disease was similar to developed countries. The overall mortality rate was 28.2/million, with a net overall survival of 79.6% for the total population. Conclusion: Childhood cancer incidence in Uruguay is similar to developed countries. Progress in diagnosis and care have improved survival immensely, but efforts must continue to keep this trend and ameliorate the outcomes.
Key words: neoplasms; infant mortality; survival rate; child; Uruguay.
RESUMO
Introdução: O câncer em crianças representa uma pequena proporção de todos os cânceres, mas continua a ser um importante problema de saúde pública. Objetivo: Descrever a incidência e a mortalidade, bem como a sobrevida do câncer infantil no Uruguai por um período de cinco anos. Método: Foram incluídos todos os tumores malignos diagnosticados em crianças de 0 a 14 anos de 2011 a 2015. Os dados foram obtidos do Registro Nacional de Câncer e dos Registros de Mortalidade do Ministério da Saúde. Os casos foram classificados de acordo com a International Classification of Childhood Cancer (ICCC-3). A informação total sobre a população foi obtida a partir de registros do censo nacional. O acompanhamento foi feito até dezembro de 2020. Resultados: A taxa de incidência padronizada foi de 128/milhão de crianças por ano. A distribuição foi semelhante à dos países industrializados. A taxa de mortalidade global foi de 28,2/milhão, com sobrevida global líquida de 79,6% para a população total. Conclusão: A incidência de câncer infantil no Uruguai é semelhante à dos países desenvolvidos. Os avanços no diagnóstico e no atendimento melhoraram substancialmente a sobrevida, mas os esforços devem continuar para se obter melhores resultados.
Palavras-chave: neoplasias; mortalidade infantil; taxa de sobrevida; criança; Uruguai.
RESUMEN
Introducción: El cáncer en los niños constituye una pequeña proporción de todos los cánceres pero continúa siendo un importante problema de salud pública. Objetivo: Describir la incidencia y mortalidad, así como la sobrevida neta del cáncer infantil en nuestro país durante cinco años. Método: Se incluyeron todos los tumores malignos diagnosticados en niños entre 0 y 14 años desde 2011 a 2015. Los datos se obtuvieron del Registro Nacional del Cáncer así como de los Registros de Mortalidad del Ministerio de Salud. Los casos se clasificaron de acuerdo con International Classification of Childhood Cancer (ICCC-3). La información de la población total fue obtenida de los registros nacionales de censo. El seguimiento se hizo hasta diciembre de 2020. Resultados: La tasa de incidencia estandarizada fue de 128/millón de niños por año. La distribución fue similar a la de los países industrializados. La tasa de mortalidad global fue de 28,2/millón, con una sobrevida global neta de 79,6% para el grupo total. Conclusión: La incidencia de cáncer infantil en Uruguay es similar a la de los países desarrollados. Los avances en el diagnóstico y el cuidado han mejorado notablemente la sobrevida, pero se deben continuar los esfuerzos para seguir mejorando los resultados.
Palabras clave: neoplasias; mortalidad infantil; tasa de supervivencia; niño; Uruguay.
INTRODUCTION
Childhood cancer is a major public health problem in developed and developing countries. It is the principal cause of death by disease in children over 1 year of age and an important cause of morbidity1. The decreased mortality rate of pediatric cancers has been one of the major success stories of medicine in the 20th century, and it continues to improve in the early 21stcentury1.
The identification of epidemiological changes in cancer favors the understanding of its multifactorial etiology. Environmental and genetic factors are involved and are correlated with each other, demonstrated by variations of the incidence of tumors in different geographical areas, as well as the variety of presentation in diversified ethnic groups2. The analysis of data from population-based cancer registries is essential for the establishment of preventive measures, and optimization of health services through appropriate policies3-5.
Incidence and mortality rates of childhood cancers vary worldwide, but it remains as a rare condition6. Some of this variation may be attributable to differences in reporting3,7.
In children aged 0-14 years incidence rates range from less than 100 per million in Africa and India to more than 150 per million in some populations in North America and Europe1,8,9.
The mean population of Uruguay is 3,440,000 inhabitants, with a mean population of 737,589 under 15 years old. As reported in previous national publications10,11 the incidence of childhood cancer was similar, but mortality rates were higher than those reported in developed countries.
The objective of this study is to describe the incidence and mortality rates as well as net survival (the probability of surviving cancer in the absence of other causes of death - NS) of childhood cancer in Uruguay for a 5-year period of time.
METHOD
Retrospective, descriptive, observational study including all cases of cancer diagnosed in children from 0 to 14 years old from January 1, 2011 to December 31, 2015.
Data were obtained from the Pediatric Oncology Registry, part of the National Cancer Registry – CHLCC (Uruguay) based in the Hematology Oncology Department at Pereira Rossell Hospital, a national pediatric oncology reference center12. The criteria for data collection were established by international standards2,5.
The list of all cancer deaths in all states of Uruguay was extracted from the National Mortality Registry from the Ministry of Public Health13.
The population by age group and sex for the study period was obtained from the lineal interpolation of the results of the 2004 Phase I Census and the 2011 National Population Census14.
All the cases were classiffied by the International Classification for Childhood Cancer (ICCC-3)5,15 based on the third revision of the International Classification of Diseases for Oncology (ICD-O-3)6 ,16. Benign tumors with morphology codes ended .0 by ICD-O-0 were excluded.
Annual age-standardized rates for incidence and mortality were adjusted by the world standard population17 and presented per million children under 15 years of age. The population included patients from 0 to 14 years old as the national pediatric registry of cancer considers this age range for pediatric cancer. Data were also presented by age-groups and sex. The study closure date was December 31, 2020.
The study was carried out using the Kaplan - Meier non-parametric test, determining the date of entry as the diagnosis, the end date is last follow-up, death date or end date of the period of the study (what happens first). Deaths by other causes were not included in the analysis, if any, they would be censored. There was no loss to follow-up as all the pediatric patients diagnosed are followed up annually until they are referred to adult centers. The NS was calculated as the quotient between overall survival for cancer patients and overall survival for individuals with similar characteristics but cancer-free18. The Log Rank test was used to compare the data. The significance level was 0.05 and the statistical software utilized was STATA v.16.019.
The Institutional Review Board (IRB) of Pereira Rossell Hospital approved the study.
RESULTS
There were 472 new childhood cases registrations in five years between 2011 and 2015, with a median follow-up by December 31, 2020 of 5-years 8 months, IQR of 4 years 3 months to 7 years 3 months.
Boys were diagnosed more frequently (263 cases, 55.7%) than girls (209 cases, 44.3%), a 1.25 male to female ratio. The number of new cases by age group were: 0 to 4 years old, 195 cases (41.3%); 5 to 9 years old, 138 cases (29.2%); 10 to 14 years old, 139 cases (21.4%).
The standardized incidence of all sites for 2011-2015 was 127.9 per million (147.4 per million in boys and 109.7 per million in girls), as shown in Table 1. By age groups, the incidence was higher in children from 0 to 4 years old, 172cases/million (41.3%), 112/million (29.2%) in the age group of 5-9 and 104/million (29.4%) for 10 to 14 years group.
|
Table 1. Standardized incidence rate for pediatric cancer in Uruguay, 2011-2015 |
||||||||
|
||||||||
|
Caption: CI = confidence interval. (*) rates expressed per million age under 15 years of age.
|
The number of cases and standardized incidence are presented in Table 2 by ICCC-3 site groups. The most common cancers among children were divided into 12 groups:
|
Table 2. Standardized incidence of childhood cancer by ICCC-3 (2011-2015) |
||||||||||||||||||||||||||||||||||||||||||||||||||||||||||||
|
||||||||||||||||||||||||||||||||||||||||||||||||||||||||||||
|
Captions: ICCC-3 = International Classification of Childhood Cancer; CNS = central nervous system; NBL = neuroblastoma. (*) Standardized incidence rate expressed per million under 15 years = old. |
||||||||||||||||||||||||||||||||||||||||||||||||||||||||||||
Leukemias were diagnosed more frequently reaching 39.3 per million, corresponding to 38.9% of all pediatric cancer cases, including acute lymphoblastic leukemia (ALL) representing 24.8% of all cancers (31.7/million). By age groups, 41.1% (61) were diagnosed from 0 to 4 years of age, 25.6% (30) from 5-9 and 22.2% (26) from 10 to 14 years old. Central nervous system (CNS) tumors were 21.7 per million or 16.9% of the total cancers.
Lymphomas were 18.7 per million (14.6%) including Hodgkin’s lymphomas with 9.5 per million (7.4%), non-Hodgkin’s lymphomas, 5.4 per million (4.2%) and Burkitt lymphomas, 3.8 per million (2.9%).
The mortality rate was 28.2 per million among children aged 0-14 for the study period. Standardized mortality by age group is shown in Table 3, the highest is 39.7 per million for the 0-4 years old group.
|
Table 3. Standardized Mortality Rate for pediatric cancer by age groups, both sexes, in Uruguay, 2011-2015 |
||||||||||||||||||||
|
||||||||||||||||||||
|
(*) standardized rates expressed per million under 15 years of age. |
The 5-year NS among children aged 0-14 was 79.6% for all cancers. There was a significant difference in survival rate between girls (83.9%) and boys (75.8%), p value=0.017 (Figure 1).
|
|
|
Figure 1. 5-years NS for boys and girls with pediatric cancer in Uruguay, 2011-2015 |
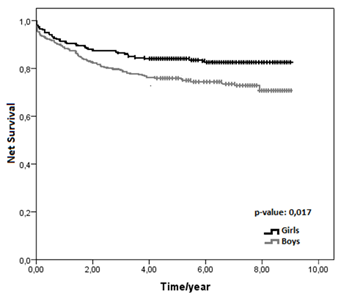
NS for children aged 5 to 9 years old was 80.7%, similar to the group aged 0 to 4 years and 10 to 14, 78.2 and 79.4%, respectively, p value=0.703 for NS compared by age group.
The combined 5-years NS for all malignant neoplasms was 79% for this period, with 78% (368 patients) alive by the end of the study.
Figure 2 shows NS for the most frequent malignancies. ALL, the largest single disease group, had a 5-year NS of 83.6%. For this condition, 82% (97/117) patients were alive by the end of the study.
|
|
|
Figure 2. NS for the most frequent malignancies, both sexes, in Uruguay, 2011-2015 |
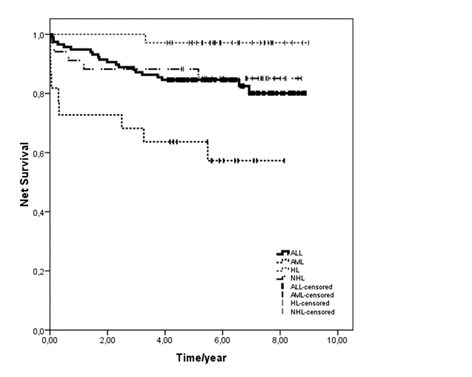
AML (22 patients) 5-year NS was 60.5% (13/22 patients alive, 59%). NS for Hodgkin’s lymphoma was 97.1% (34/35, 97% patients alive). NS for non-Hodgkin’s lymphoma was 85.1% (29/35 patients alive). NS for CNS tumors was 58.9% for this period.
DISCUSSION
This study presents the results of a five-year evaluation period of incidence and mortality for pediatric cancer in Uruguay from 2011 to 2015 and the opportunity to critically evaluate the progress made since former reports. The childhood cancer incidence pattern in Uruguay was similar to Europe’s and North America’s, a fact already reported in past publications10,11. However, compared to the results of the International Agency for Research on Cancer (IARC)’s the Automated Cancer Information System (ACCIS)20, the incidence of all tumors combined was slightly lower than those reported in developed countries. Considering childhood cancer as a group of uncommon diseases and the small size of the population, random fluctuations may be erroneously manifested as trends. Leukemia, the most common cancer in children worldwide, has the largest impact on total cancer incidence and is mainly reflected in ALL, which was previously reported (35.5 per million), 31.8 per million according to the present study.
In the 1970s, the United States presented a mortality rate of 51 per million children and adolescents and 23 for 20156,21. In Uruguay in the 90s the mortality rate was 62 per million children under 15 years old10, drawing attention to the remarkable disparity in ALL in comparison to North America with a mortality rate of 16.5 in Uruguay versus 6 per million in the United States and Canada. However, in 2012, this rate decreased to 31 per million children under 15 years old11 and achieving 28 per million according to the present study, showing a clear difference, a rate similar to developed countries.
CNS tumors patients presented a 5-year NS of 58.9% because currently this type of neoplasms is the main cause of death secondary to all cancers. As this study did not include benign CNS tumors, in addition to the specific location, it is possible that a bias have occurred.
Childhood cancer treatment in Uruguay in the 1980’s was assigned to departments and various health institutions. Although the centralization of childhood cancer began in 1992 when the first pediatric oncology ward was opened, several pathologies were still treated by non-pediatric specialists. The XXVIIth meeting of the International Society of Pediatric Oncology (SIOP) in 1995 in Montevideo, for the first-time outside Europe or North America, was a remarkable contribution for the definitive understanding and development of the specialty. As a consequence, several national and international initiatives were developed in Uruguay and in other Latin American Countries – Argentine, Chile, Brazil – (twinning programs, Monza School of Pediatric Hematology Oncology for Latin America, participation in clinical trials, etc.). Since 2002, Uruguayan patients were included in Berlin-Frankfurt-Munster – BFM clinical trials and, a few years later, patients with solid tumors participated of the Latin America Pediatric Oncology Group (GALOP), a regional organization for clinical trials of solid tumors.
Comparing the mortality rate of 2012 (31 per million) with publications from 1992 to 1994 (62 per million)10,11, there has been a drop of 28 per million.
The mortality rate for pediatric cancer in children under 15 years old in Uruguay is the lowest among Latin American countries. Chile and Argentina have similar mortality rate of 34 and 36 per million, respectively, while Brazil, Ecuador and Colombia have higher rates, 40, 47 and 46 per million22.
The 5-year NS for all malignant neoplasms combined was 79% for the period investigated with 78% (368 patients) alive by the end of the study, 54.7% higher than in 1992-1994. Although it is not the objective of the study to compare with previous data because they do not report NS, the percentage of patients alive in 2011-2015 is greater than in 1992-1994 especially considering ALL and AML. For ALL, 82% (97/117) patients were alive, in contrast with 53.4% in 1992-1994. For AML (13/22 patients alive, 59%, versus 21% in the period 1992-1994). For Hodgkin’s lymphoma (34/35, 97% patients were alive vs 73% in 1992-1994). The percentage of patients alive is higher in the present study for non-Hodgkin’s lymphoma and CNS tumors.
The 5-year NS for ALL, the largest single disease group, was 83.6%; for AML, 60.5%; for Hodgkin’s lymphoma was 97.1% and NS for non-Hodgkin’s lymphoma was 85.1%. As previous reports don’t express this variable, further comparisons cannot be done, although the improvement in mortality rate is notorious. Future investigations in the department will continue to analyze survival for comparison and registration.
The goals, comparable to international objectives, are to achieve homogeneous results that allow the cure and excellent care of pediatric cancer as well as to improve the long time follow up. New challenges for low-and-middle-income countries are already being developed. Traditional diagnostic techniques and treatments approaches with chemotherapy had reached top results and costly molecular biology knowledge will be soon into bedside. Population-based analysis allows to evaluate results and project goals in short and long terms.
CONCLUSION
This study confirms that the standard of incidence of childhood cancer in Uruguay continues to be similar to developed countries and net survival shows a trend to improvement in comparison with previous years. Efforts need to continue to prioritize childhood cancer to ensure free access to standard quality of care in diagnosis, treatment and long term follow up, and to facilitate the innovative treatments required to improve the outcomes. Continuous collection of high-quality data is relevant for monitoring progress and identify opportunities for further improvements in childhood cancer.
Centralized care and international cooperation are essential pillars for the development of new opportunities, increased awareness, and improved outcomes for childhood cancer. In Uruguay over time, the fundamental step was the support of a national foundation, which ensured social support for patients and families, as well as the continuous improvement of the existing medical facilities, infrastructure, and human resources.
CONTRIBUTIONS
Fabiana Morosini and Luis Castillo contributed substantially to the study design, acquisition, analysis and interpretation of the data, wording and critical review. Anaulina Silveira contributed to the study design, acquisition, analysis and interpretation of the data. Vanessa Arias contributed substantially to the study design, acquisition and interpretation of the data, wording and critical review. All the authors approved the version to be published.
DECLARATION OF CONFLICT OF INTERESTS
There is no conflict of interests to declare.
None.
REFERENCES
1. Howlader N, Noone AM, Krapcho M, et al., editors. SEER cancer statistics review, 1975-2018 [Internet]. Bethesda (MD): National Cancer Institute; 2021 [cited 2021 Aug 15]. Available from: https://seer.cancer.gov/csr/1975_2018
2. World Health Organization [Internet]. Geneva: WHO; c2023. Childhood cancer; 2021 Dec 13 [cited 2021 Aug 15]. Available from: https://www.who.int/news-room/fact-sheets/detail/cancer-in-children
3. Pan American Health Organization [Internet]. Washington (DC): PAHO; [date unknown]. Childhood and adolescence cancer; [cited 2021 Aug 15]. Available from: https://www.paho.org/en/topics/childhood-and-adolescence-cancer
4. International Agency for Research on Cancer; World Health Organization. Global initiative for cancer registry development [Internet]. Lyon (France): IARC; c2022. [cited 2021 Aug 15]. Available from: https://gicr.iarc.fr
5. Jensen OM, Parkin DM, MacLennan R, editors. Cancer registration: principles and methods [Internet]. Lyon (France): (IARC; 1991. (IARC Scientific Publication; nº 95) [cited 2021 Aug 15]. Available from: https://publications.iarc.fr/_publications/media/download/3509/5f5f43d160b02029dea997b05cce7b7d41c50702.pdf
6. National Cancer Institute [Internet]. [Bethesda (MD)]: National Cancer Institute (US); [date unknown]. Cancer in children and adolescents; [reviewed 2021 Nov 4; cited 2021 Aug 15]. Available from: https://www.cancer.gov/types/childhood-cancers/child-adolescent-cancers-fact-sheet
7. Lam CG, Howard SC, Bouffet E, et al. Science and health for all children with cancer. Science. 2019;363(6432):1182-6. doi: https://doi.org/10.1126/science.aaw4892
8. Stiller CA. Epidemiology and genetics of childhood cancer. Oncogene. 2004;23(38):6429-44. doi: https://doi.org/10.1038/sj.onc.1207717
9. Steliarova-Foucher E, Colombet M, Ries LAG, et al. International incidence of childhood cancer, 2001-10: a population-based registry study. Lancet Oncol. 2017;18(6):719-31. doi: https://doi.org/10.1016/S1470-2045(17)30186-9
10. Castillo L, Fluchel M, Dabezies A, et al. Childhood cancer in Uruguay: 1992-1994. Incidence and mortality. Med Pediatr Oncol. 2001;37(4):400-4. doi: https://doi.org/10.1002/mpo.1217
11. Castillo Malmiera L, Dabezies Antia A, Dufort y Álvarez G, et al. Evolución del cáncer pediátrico en Uruguay (1992-2011). Arch Pediatr Urug. 2012;83(1):26-30.
12. Comisión Honoraria de Lucha contra el Cáncer [Internet]. Montevideo: CHLCC; [1989]. Registro Nacional de Cáncer; [acceso 2022 jul 1]. Disponible en: https://www.comisioncancer.org.uy/categoria/Registro-Nacional-de-Cancer-14
13. Ministerio de Salud (UY) [Internet]. Montevideo (Uruguay): Ministerio de Salud; c2020. Estadísticas de defunciones; [acceso 2022 jul 1]. Disponible en: https://uins.msp.gub.uy/index.html#def
14. Instituto Nacional de Estadística. Resultados del Censo de población 2011: población, crecimiento y estructura por sexo y edad [Internet]. Uruguay: INE; [2012] [acceso 2022 jul 1]. Disponible en: https://www.ine.gub.uy/documents/10181/35289/analisispais.pdf
15. Steliarova-Foucher E, Stiller C, Lacour B, et al. International classification of childhood cancer, third edition. Cancer. 2005;103(7):1457-67. doi: https://doi.org/10.1002/cncr.20910
16. Fritz A, Percy C, Jack A, et al., editors. ICD-O: International classification of diseases for oncology [Internet]. 3rd ed. Geneva: WHO; 2020 [cited 2022 July 1]. Available from: https://apps.who.int/iris/bitstream/handle/10665/96612/9789241548496_eng.pdf
17. Ahmad OB, Boschi-Pinto C, Lopez AD, et al. Age standardization of rates: a new WHO standard [Internet]. Geneva: World Health Organization; 2001. (GPE Discussion Paper Series; nº 31) [cited 2022 July 1]. Available from: https://cdn.who.int/media/docs/default-source/gho-documents/global-health-estimates/gpe_discussion_paper_series_paper31_2001_age_standardization_rates.pdf
18. Cho H, Howlader N, Mariotto AB, et al. Estimating relative survival for cancer patients from the SEER Program using expected rates based on Ederer I versus Ederer II method. [Bethesda (MD)]: National Cancer Institute (US); 2011. (Technical Report #2011-01). Available from: https://surveillance.cancer.gov/reports/
19. Stata statistical software: release 16. College Station (Texas): StataCorp LLC; 2019.
20. ACCIS: Automated Cancer Information System [Internet]. Lyon (France): IARC. c1965-2023 [cited 2021 Aug 15]. Available from: https://accis.iarc.fr
21. Chatenoud L, Bertuccio P, Bosetti C, et al. Childhood cancer mortality in America, Asia, and Oceania, 1970 through 2007. Cancer. 2010;116(21):5063-74. doi: https://doi.org/10.1002/cncr.25406
22. Prieto Bravo C, Cuadrado C, Gónzales I. Cáncer Infantil en latinoamérica: un análisis comparativo de la respuesta de los sistemas de salud. Medwave [Internet]. 2019;19(Suppl 1):SP95. doi: http://doi.org/10.5867/medwave.2019.S1
Recebido em 16/8/2022
Aprovado em 20/12/2022
Associate-Editor: Jeane Glaucia Tomazelli. Orcid iD: https://orcid.org/0000-0002-2472-3444
Scientific-Editor: Anke Bergmann. Orcid iD: https://orcid.org/0000-0002-1972-8777
![]()
Este é um artigo publicado em acesso aberto (Open Access) sob a licença Creative Commons Attribution, que permite uso, distribuição e reprodução em qualquer meio, sem restrições, desde que o trabalho original seja corretamente citado.
©2019 Revista Brasileira de Cancerologia | Instituto Nacional de Câncer | Ministério da Saúde