Gastric Cancer Mortality in Ceará in Brazil’s Northeastern, 2000-2022: Spatio-Temporal Study
Mortalidade por Câncer Gástrico no Ceará, Nordeste do Brasil, 2000-2022: Estudo Espaço-Temporal
Mortalidad por Cáncer Gástrico en Ceará, Nordeste del Brasil, 2000-2022: Estudio Espacio-Temporal
https://doi.org/10.32635/2176-9745.RBC.2025v71n3.5266
1Universidade Federal do Ceará (UFC), Faculdade de Medicina, Departamento de Clínica Médica, Programa de Pós-Graduação em Ciências Médico-Cirúrgicas. Fortaleza (CE), Brasil. E-mail: lucialib.bessa@gmail.com. Orcid iD: https://orcid.org/0000-0001-8258-4684
2,5-8UFC, Faculdade de Medicina, Programa de Pós-Graduação em Ciências Médico-Cirúrgicas. Fortaleza (CE), Brasil. E-mails: enfermeirohelionobre@gmail.com; anasuzetelopes@gmail.com; edluizoliveira@hotmail.com; vitortome14@gmail.com; dellymaia@hotmail.com. Orcid iD: https://orcid.org/0000-0003-0156-5882; Orcid iD: https://orcid.org/0009-0005-7068-1344; Orcid iD: https://orcid.org/0009-0009-0474-2320; Orcid iD: https://orcid.org/0009-0005-5377-3925; Orcid iD: https://orcid.org/0009-0006-9915-0106
3,4,9UFC, Faculdade de Medicina, Programa de Pós-Graduação em Saúde Coletiva. Fortaleza (CE), Brasil. E-mails: heukelbach@ufc.br; anderson_deco.f2@hotmail.com; taynaralaissilva@gmail.com. Orcid iD: https://orcid.org/0000-0002-7845-5510; Orcid iD: https://orcid.org/0000-0002-1816-9459; Orcid iD: https://orcid.org/0000-0003-1558-0506
10UFC, Faculdade de Medicina, Departamento de Saúde Comunitária, Programa de Pós-Graduação em Saúde Coletiva. Fortaleza (CE), Brasil. E-mail: novaes@ufc.br. Orcid iD: https://orcid.org/0000-0001-7982-1757
Corresponding author: Lucia Libanez Bessa Campelo Braga. Departamento de Medicina Clínica da UFC. Rua Professor Costa Mendes, 1281 – Rodolfo Teófilo. Fortaleza (CE), Brasil. CEP 60430-140. E-mail: lucialib@terra.com.br
ABSTRACT
Introduction: In recent decades, the prevalence of gastric cancer (GC) has increased in Brazil’s Northeastern, especially in the state of Ceará. Objective: To analyze temporal trends and spatial patterns of GC mortality over a 23-year period in Ceará. Method: All registered death certificates (DC) (GC registered as any cause of death) from 2000 to 2022 were included. Temporal trends were assessed by joinpoint regression models, while spatial patterns were assessed by spatial autocorrelation, using the local Moran index based on Local Indicators of Spatial Association (LISA). Results: GC was detected in 16,670 DCs (1.5% of all deaths). Age- and sex-adjusted mortality was 8.44/100,000 population. The highest mortality rates were found in the southern parts of the state and around a northern major urban center. Analysis over time showed a rising trend (Average Annual Percent Change: AAPC 1.2; 95%CI 0.6;2.1), especially in males (AAPC 1.6; 95%CI 1.1;2.1), individuals <45 years (AAPC 2.1;3.7), residents of the central region (AAPC 3.2, 95%CI 1.8;5.1) and high deprivation index municipalities (AAPC 2.6, 95%CI 1.3;5.0). Spatial-temporal clusters of high risk for GC-related mortality from 2000 to 2017 were identified, with no statistical significance in the period 2018-2022: clusters were identified in the south until 2011 and in the northwest from 2006 to 2017. Conclusion: GC mortality has increased in Ceará during the study period. High risk areas for GC mortality were identified, enabling focused integrated actions to strengthen prevention, diagnosis, surveillance and control networks.
Key words: Stomach Neoplasms/epidemiology; Demography/trends; Spatial Analysis; Epidemiology/trends; Mortality/trends.
RESUMO
Introdução: Nas últimas décadas, a prevalência de câncer gástrico (CG) tem aumentado no Nordeste do Brasil, especialmente no Estado do Ceará. Objetivo: Analisar tendências temporais e padrões espaciais da mortalidade por câncer gástrico, durante um período de 23 anos no Ceará. Método: Foram incluídas declarações de óbito (DO) registradas (CG registrado como qualquer causa de morte) de 2000-2022. Tendências temporais foram avaliadas por modelos de regressão joinpoint. Padrões espaciais foram avaliados por autocorrelação espacial, usando índice de Moran local com base nos Indicadores Locais de Associação Espacial (LISA). Resultados: O CG foi detectado em 16.670 DO (1,5% de todas as mortes). A mortalidade ajustada por idade e sexo foi de 8,44/100 mil habitantes. Taxas de mortalidade altas foram encontradas no Sul do Estado e em torno de um grande centro urbano no Norte. A análise ao longo do tempo mostrou uma tendência de aumento (Variação Percentual Anual Média [VPAM] 1,2; IC95% 0,6;2,1), em homens (VPAM 1,6; IC95% 1,1;2,1), pessoas com menos de 45 anos (VPAM 2,1;3,7), residentes da região central (VPAM 3,2, IC95% 1,8;5,1) e municípios com alto índice de privação (VPAM 2,6, IC95% 1,3;5,0). Foram identificados clusters espaço-temporais de alto risco para mortalidade relacionada ao CG de 2000-2017, sem significância estatística no período 2018-2022: os clusters foram identificados no Sul até 2011 e Noroeste de 2006-2017. Conclusão: A mortalidade por CG aumentou no Estado do Ceará no período do estudo. Foram identificadas áreas de alto risco para mortalidade por CG, possibilitando ações integradas focadas para fortalecer redes de prevenção, diagnóstico, vigilância e controle.
Palavras-chave: Neoplasias Gástricas/epidemiologia; Demografia/tendências; Análise Espacial; Epidemiologia/tendências; Mortalidade/tendências.
RESUMEN
Introducción: En últimas décadas, la prevalencia del cáncer gástrico (CG) ha aumentado en nordeste de Brasil, especialmente en el Estado de Ceará. Objetivo: Analizar tendencias temporales y patrones espaciales de mortalidad por cáncer gástrico durante un período de 23 años en Ceará. Método: Se incluyeron certificados de defunción (CD) registrados (CG registrado como cualquier causa de muerte) entre 2000-2022. Tendencias temporales se evaluaron mediante modelos de regresión joinpoint. Patrones espaciales se evaluaron mediante autocorrelación espacial, utilizando el índice de Moran local basado en los Indicadores Locales de Asociación Espacial (LISA). Resultados: Se detectó CG en 16 670 CD (1,5% de todas las muertes). La mortalidad ajustada por edad y sexo fue de 8,44/100 000 habitantes. Se observaron tasas de mortalidad elevadas en el sur del Estado y alrededor de un gran centro urbano en el norte. El análisis a lo largo del tiempo mostró una tendencia ascendente (Variación Porcentual Anual Media [VAPM] 1,2; IC95% 0,6;2,1), en hombres (VAPM 1,6; IC95% 1,1;2,1), personas menores de 45 años (VAPM 2,1;3,7), residentes de la región central (VAPM 3,2; IC95% 1,8;5,1) y municipios con un alto índice de privación (VAPM 2,6; IC95% 1,3;5,0). Se identificaron clusters espacio-temporales de alto riesgo de mortalidad relacionadas con el CG entre 2000 y 2017, sin significación estadística en el periodo 2018-2022: los clusters se identificaron en el sur hasta 2011 y en el noroeste entre 2006-2017. Conclusión: La mortalidad por CG aumentó en el Estado de Ceará durante el período de estudio. Se identificaron áreas de alto riesgo de mortalidad por CG, que permitió acciones integradas focalizadas para fortalecer redes de prevención, diagnóstico, vigilancia y control.
Palabras clave: Neoplasias Gástricas/epidemiología; Demografía/tendencias; Análisis Espacial; Epidemiología/tendencias; Mortalidad/tendencias.
INTRODUCTION
As the fifth most common malignant neoplasm and the fourth leading cause of death worldwide, gastric cancer (GC) represents a significant public health challenge. In 2022, GC was responsible for almost one million new cases and an estimated 659,853 deaths1. If current GC rates persist, 1.8 million cases and 1.3 million deaths will occur in 2040. These figures are 66% and 71% higher than those estimated in 20202.
The number of GC cases and mortality rates has been declining worldwide since the mid-20th century, particularly in North America, Northern Europe, Australia, Japan, and Korea1. It is noteworthy that the decline in GC is primarily due to distal disease, the most common subtype (accounting for approximately 82% of all GC cases worldwide), which is also known as “non-cardia” GC and is associated with Helicobacter pylori infection3.The incidence of proximal GC, or “cardia cancer,” has been increasing and is thought to be linked to the rise in gastro-esophageal reflux disease (GERD) and obesity2.
The global decline in GC incidence and mortality is associated with improvements in socioeconomic development, a reduction in the prevalence of H. pylori infection (the most significant risk factor for distal GC), a decrease in smoking and high salt intake, and the availability of refrigeration and better sanitation1. In addition, population screening for early detection of GC and population-level eradication of H. pylori in high-risk regions have contributed to this decline4,5.
Conversely, the high incidence and increased mortality of distal GC are still observed, particularly in the most underserved regions with low Human Development Index (HDI)2.
In Brazil, GC is the fourth and sixth most common internal malignant neoplasm in men and women, respectively6. Over the last two decades, there has been a significant decrease in the incidence of GC in developed regions, while there has been an increase in less developed areas – North and Northeast – which have the worst health indicators in the country7-9. Exposure to risk factors in addition to different cultures and habits also contribute to these inequalities9.
In the Northeast region, GC has the second highest incidence (10.70/100,000 men and 4.96/100,000 women)8. The state of Ceará has the highest incidence and mortality rates of GC, one of the most common internal malignancies in men in the state, along with lung, and prostate cancer6. Nevertheless, the number of local studies addressing the epidemiology of GC is limited10.
The study of the dynamics as well as the mapping of the geographical patterns of GC mortality in Ceará can help to plan, evaluate and implement public policies to control GC. This study aims to analyze the spatial patterns and temporal trends of GC mortality in the state of Ceará, Brazil, from 2000 to 2022.
METHOD
This is a statewide population-based ecological study based on spatial and temporal analysis of GC mortality. Official secondary data from the Ministry of Health National Mortality System (SIM), based on death certificates (DCs), were used. The units of analysis were the 184 municipalities of Ceará.
Ceará is located in Brazil’s Northeast region. It has a tropical climate, a population of 9.2 million inhabitants in 2024 and a population density of 59.07 inhabitants per square kilometer. The state is divided into 184 municipalities, and is operationally organized into 22 health micro-regions and 5 health macro-regions (Figure 111).
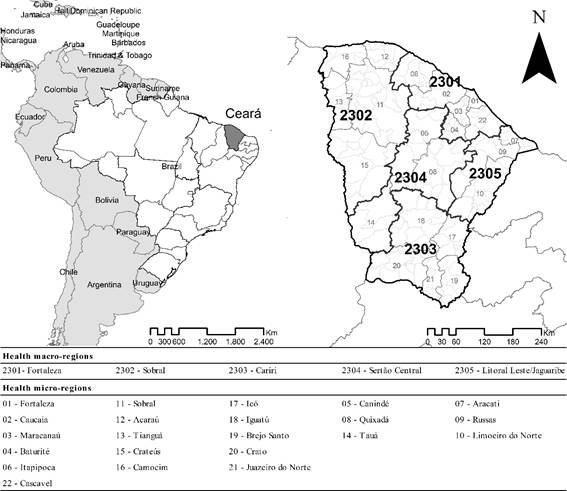
Figure 1. Study area: Ceará state in Brazil’s Northeastern, health macro-regions and health micro-regions
Source: IBGE11.
SIM data for the period 2000-2022 were obtained from the databases of the Computer Department of the Brazilian National Health System (DATASUS) of the Ministry of Health (MoH)12.
All GC-related death records as the underlying or associated causes were selected using the International Statistical Classification of Diseases and Related Health Problems in its tenth revision (ICD-10). The following ICD-10 codes were included: C16-malignant neoplasm of stomach, C16.0-malignant neoplasm of cardia, C16.1-malignant neoplasm of fundus of stomach, C16.2-malignant neoplasm of body of stomach, C16.3-malignant neoplasm of pyloric antrum, C16.4-malignant neoplasm of pylorus, C16.5-malignant neoplasm of small curvature of stomach, unspecified, C16.6 - malignant neoplasm of large curvature of stomach, unspecified, C16.8 - malignant neoplasm of stomach with invasive lesion, and C16.9 - malignant neoplasm of stomach, unspecified13.
The population data were obtained from the “Instituto Brasileiro de Geografia e Estatística (IBGE)” through DATASUS14. It was based on the Brazilian 2000, 2010 and 2022 censuses , as well as municipal population estimates through intercensal projections (2001-2009; 2011-2021). This dataset included demographic information as age and sex14.
A total of 23 SIM files were downloaded for Ceará. The files were available in .dbc format and were subsequently merged into a single database using TabWin 4.1515 software, which was also saved in “.dbc” format for recognition by statistical analysis programs. The database was managed, and statistical analyses were performed using Stata16 software version 11.2.
The relative frequencies of sociodemographic variables in relation to specific GC mortality were calculated, including the following sociodemographic variables: sex (male and female), age groups (group 1: <15, 15-29, 30-39, 40-49, 50-59, 60-69, ≥70 and group 2: <45, ≥45 years), ethnicity (Caucasian, Afro-Brazilian, Asian, Pardo-Brazilians, Indigenous), health macro-region (Litoral, Leste/Jaguaribe, Sertão Central, Cariri, Sobral, Fortaleza), residence in the capital, (yes, no), and municipality size (small size I, ≤20,000 inhabitants; small size II, 20.001;50,000 inhabitants; medium size, 50.001;100,000 inhabitants; large size: >100,001 inhabitants).
The Brazilian Deprivation Index (IBP) is a tool designed to measure social inequalities in the country, at the level of census sectors in small areas and is suitable to be used in municipalities. This index is based on three variables extracted from the 2010 IBGE Census17: (1) the percentage of households with per capita income of less than or equal to half minimum wage; (2) the percentage of illiterate individuals aged 7 and over; and (3) the mean percentage of individuals with inadequate access to sanitation, water, garbage collection and no toilet/shower, combined in a single measure18.
Crude and age- and sex-adjusted GC mortality rates were calculated, based on the mean number of deaths during the period, with 2010 as the population reference period per 100,000 inhabitants.
Age-and sex-adjusted rates per 100,000 inhabitants were calculated over time for the health macro-regions. The data on the respective rates in the time series were presented in graphical form. The relative risks (RR) and corresponding 95% confidence intervals (CI) were calculated. Pearson's chi-squared test (χ2) was used to identify the significance of differences related to the socio-demographic variables included in the study.
To assess the trend of the socio-demographic indicators over time, the Poisson regression analysis with joinpoints was applied, which determines statistical significance, using the Monte Carlo permutation method, recognizing the line of best fit at each follow-up. The analyses produced two results: annual percent change (APC) and average annual percent change (AAPC), with the respective 95%CI. The APC/AAPC results can be interpreted as an increase (positive results) or a decrease (negative results), both with statistical significance, or as no trend (no statistical significance)19. Joinpoint20 Regression® software version 5.0.0 was used for these analyses.
To analyze the municipal spatial patterns of GC mortality, age- and sex-adjusted mortality rates were calculated per 100,000 inhabitants for the period 2000-2022, using the direct method and the age structure of the 2010 Brazilian census.
To determine the presence of spatial autocorrelation, the local Moran index was calculated, which is based on the Local Indicators of Spatial Association (LISA), recognizing specific areas. The results indicate the presence of significant clustering among municipalities with similar values21. The spatial analysis was carried out using ArcGIS22 software version 9.3 (Environmental Systems Research Institute, Redlands, CA, USA) to calculate autocorrelation indicators and create thematic maps.
The Jenks natural breaks method (per 100,000 inhabitants) was used to determine the class breaks of the age- and sex-adjusted mortality rate indicators. The spatial unit of analysis was the municipality of residence (n=184), excluding DCs with unknown municipalities and/or invalid coding.
The Ethics Review Board of “Universidade Federal do Ceará” (Fortaleza, Brazil) approved the study in 2015, report number 1,320,661, (CAAE submission for ethical review 50537415.3.0000.5054) for the analysis of GC mortality data from 2000 to 2022 in compliance with Directive 51023 dated Abril 7, 2016 of the National Health Council (CNS).
RESULTS
A total of 16,670 deaths by GC were recorded between 2000 and 2022, accounting for 1.5% of the state's 1,133,334 deaths. GC was the underlying cause in 15,722 (94.3%) deaths. The mean adjusted mortality rate was 8.44/100,000 inhabitants (95%CI 8.31;8.57) (Table 1). Mortality rate was higher among males (n=10.612; 63.7%, adjusted mean rate 11.04/100,000 inhabitants, 95%CI 10.83;11.25), and in individuals aged 45 years and older (n=15,428; 92.5%, adjusted mean rate 5.75/100,000 inhabitants, 95%CI 5.53;5.97).
A higher proportion of GC deaths was observed among individuals living in rural cities (n=12,073, 72.4%, adjusted mean rate of 8.32/100,000 inhabitants, 95%CI 8.17;8.47), in municipalities with very high IBP (n=10,056, 60.3%, mean adjusted rate of 8.29/100,000 inhabitants, 95%CI 8.12;8.45), in the macro-region Fortaleza (n=7,820, 46.9%, mean adjusted rate of 8.46/100,000 inhabitants, 95%CI 8.27;8.64), and large cities (>100,000 inhabitants) (n=7,084, 42.5%, mean adjusted rate of 8.78/100,000 inhabitants, 95%CI 8.57;8.98) (Table 1).
There was a higher risk of death by GC among men, compared to women (RR: 1.84, 95%CI 1.58;2.14, p <0.0001), those aged 45 years or older compared (RR: 38.49, 95%CI 29.17;50.78, p < 0.0001) to 45 years or less, those aged 70 or over compared to those aged 40-49 (RR: 14.51, 95%CI 10.97;19.19, p < 0.0001), and those living in the macro-region Cariri compared to Fortaleza (RR: 1.26, 95%CI 1.03;1.54, p = 0.0220) (Table 1).
Table 1. Number and percentage, crude rate, and adjusted rate (per 100,000 inhabitants), and relative risk of gastric cancer mortality by sociodemographic variables. State of Ceará, Brazil’s Northeast, 2000-2022
|
Indicator/Variables |
Deaths |
RR (95%CI) |
p |
||
|
Deaths % |
Crude mortality rate |
Adjusted mortality rate (95%CI) |
|
|
|
|
Total |
16.670 (100.0) |
8.41 |
8.44 (8.31;8.57) |
- |
- |
|
Sex |
|
|
|
|
|
|
Female |
0.58 (36.3) |
5.96 |
5.97 (5.82;6.12) |
Ref |
|
|
Male |
10,612 (63.7) |
10.97 |
11.04 (10.83;11.25) |
1.84 (1.58;2.14) |
<0.0001 |
|
Age group 1 (years)* |
|
|
|
|
|
|
<15 |
6 (0.0) |
0.01 |
0.01 (00.00;00.02) |
0.00 (0.00;0.06) |
0.0001 |
|
15-29 |
144 (0.9) |
0.26 |
0.26 (0.22;0.31) |
0.04 (0.02;0.10) |
<0.0001 |
|
30-39 |
573 (3.4) |
1.99 |
1.94 (1.79;2.10) |
0.36 (0.23;0.58) |
<0.0001 |
|
40-49 |
1.307 (7.8) |
5.49 |
5.62 (5.31;5.92) |
Ref |
|
|
50-59 |
2.518 (15.1) |
15.72 |
14.74 (14.17;15.32) |
2.84 (2.06;3.91) |
<0.0001 |
|
60-69 |
3.975 (23.8) |
36.05 |
34.96 (33.87;36.05) |
6.55 (4.85;8.83) |
<0.0001 |
|
≥70 |
8.142 (48.8) |
80.02 |
79.68 (77.95;81.41) |
14.51 (10.97;19.19) |
<0.0001 |
|
Age group 2 (years)* |
|
|
|
|
|
|
< 45 |
1.237 (7.4) |
0.83 |
0.53 (0.49;0.57) |
Ref |
|
|
≥ 45 |
15.428 (92.5) |
31.88 |
25.75 (25.35;26.15) |
38.49 (29.17;50.78) |
<0.0001 |
|
Ethnicity* |
|
|
|
|
|
|
Caucasian |
4.456 (26.7) |
7.24 |
- |
Ref |
|
|
Afro-Brazilian |
664 (4.0) |
7.49 |
- |
1.04 (0.70;1.53) |
0.8514 |
|
Asian-descendant |
76 (0.5) |
3.18 |
- |
0.40 (0.13;1.25) |
0.1135 |
|
Pardo-Brazilians |
10.288 (61.7) |
8.49 |
- |
1.17 (0.99;1.38) |
0.0681 |
|
Indigenous |
28 (0.2) |
6.09 |
- |
0.69 (0.10;4.92) |
0.7111 |
|
Macro health region* |
|
|
|
|
|
|
Litoral Leste/Jaguaribe |
1.129 (6.8) |
9.31 |
8.40 (7.91;8.89) |
1.22 (0.90;1.64) |
0.1997 |
|
Sertão Central |
1.434 (8.6) |
9.99 |
8.63 (8.18;9.09) |
1.30 (0.99;1.70) |
0.0573 |
|
Cariri |
3.184 (19.1) |
9.65 |
8.70 (8.40;9.00) |
1.26 (1.03;1.54) |
0.022 |
|
Sobral |
3.098 (18.6) |
8.50 |
8.15 (7.86;8.44) |
1.11 (0.91;1.36) |
0.285 |
|
Fortaleza |
7.820 (46.9) |
7.64 |
8.46 (8.27;8.64) |
Ref |
|
|
Resident in the capital |
|
|
|
|
|
|
No |
12.073 (72.4) |
8.59 |
8.32 (8.17;8.47) |
1.08 (0.92;1.27) |
0.3686 |
|
Yes |
4.592 (27.5) |
7.96 |
8.88 (8.62;9.14) |
Ref |
|
|
IBP* |
|
|
|
|
|
|
Very low |
- |
- |
- |
- |
- |
|
Low |
- |
- |
- |
- |
- |
|
Medium |
4.592 (27.5) |
7.98 |
8.88 (8.62;9.14) |
0.89 (0.76;1.06) |
0.1875 |
|
High |
2.017 (12.1) |
7.09 |
8.58 (8.20;8.96) |
0.80 (0.63;1.00) |
0.0499 |
|
Very high |
10.056 (60.3) |
8.95 |
8.29 (8.12;8.45) |
Ref |
|
|
Size of municipality* |
|
|
|
|
|
|
Small Size I |
2.387 (14.3) |
9.52 |
8.30 (7.96;8.63) |
Ref |
|
|
Small Size II |
4.006 (24) |
9.19 |
8.34 (8.08;8.60) |
0.96 (0.75;1.23) |
0.7561 |
|
Medium Size |
3.188 (19.1) |
8.21 |
8.14 (7.86;8.42) |
0.86 (0.67;1.11) |
0.2549 |
|
Large Size |
7.084 (42.5) |
7.80 |
8.78 (8.57;8.98) |
0.82 (0.65;1.02) |
0.0745 |
Captions: Significantly different (p < 0.05); 95% CI: 95% confidence intervals; RR: Relative risk; IBP: Brazilian Deprivation Index; Ref: Reference; -: Not calculated; N: Number; %: percent. * Data not available in all cases.
The temporal evaluation identified up to three (3) breakpoints (joinpoints) in the temporal trends of the sociodemographic indicators. The overall time trend showed an increase (AAPC 1.2, 95%CI 0.6;2.1), which was more pronounced in males (AAPC 1.6, 95%CI 1.1;2.1), age <45 years (AAPC 2.1, 95%CI 0.8;3.7), and Pardo-Brazilians (AAPC 3.7, 95%CI 2.9;4.9). The increases were more significant among residents of the macro-region Sertão Central (AAPC 3.2, 95%CI 1.8;5.1), in municipalities with higher IBP (AAPC 2.6, 95%CI 1.3;5.0), in medium-sized cities (AAPC 1.9, 95%CI 1.2;2.6), and in rural municipalities (AAPC 1.3, 95%CI 0.8;1.9) (Table 2).
Table 2. Joinpoint regression analysis by sociodemographic variables of GC mortality, Ceará State, Brazil, 2000-2022
Indicator/Variables |
Trends |
Entire period |
|
Period |
APC (95%CI) |
AAPC (95%CI) |
|
Total |
2000-2018 |
2.0* (1.6;5.6) |
1.2* (0.6;2.1) |
2018-2022 |
-2.2 (-10.0;1.3) |
||
Sex |
|
|
|
Female |
2000-2015 |
2.7* (1.8;8.1) |
1.3* (0.4;2.5) |
2015-2022 |
-1.5 (-8.9;1.0) |
||
Male |
2000-2022 |
1.6* (1.1;2.1) |
1.6* (1.1;2.1) |
Age group 1 (years) |
|
|
|
<15 |
2000-2022 |
-1.6 (-5.2;1.6) |
-1.6 (-5.2;1.6) |
15-29 |
2000-2022 |
1.0 (-1.7;3.9) |
1.0 (-1.7;3.9) |
30-39 |
2000-2022 |
0.4 (-1.2;2.3) |
0.4 (-1.2;2.3) |
40-49 |
2000-2022 |
-0.6 (-1.5;0.2) |
-0.6 (-1.5;0.2) |
50-59 |
2000-2022 |
-0.8 (-2.0;0.5) |
-0.8 (-2.0;0.5) |
60-69 |
2000-2018 |
-0.1 (-0.8;3.0) |
-1.4* (-2.2;-0.3) |
2018-2022 |
-6.9* (-17.7;-1.4) |
||
≥70 |
2000-2006 |
3.6* (0.2;20.7) |
0.4 (-0.7;1.7) |
2006-2022 |
-0.8 (-6.0;0.0) |
||
Age group 2 (years) |
|
|
|
<45 |
2000-2022 |
2.1* (0.8;3.7) |
2.1* (0.8;3.7) |
≥45 |
2000-2022 |
-0.5 (-1.0;0.0) |
-0.5 (-1.0;0.0) |
Ethnicity |
|
|
|
Caucasian |
2000-2007 |
3.8* (1.3;15.0) |
1.1* (0.2;2.0) |
2007-2022 |
-0.2 (-3.3;0.6) |
||
Afro-Brazilian |
2007-2022 |
-0.2 (-3.3;0.6) |
-2.2* (-4.3;-0.1) |
Asian-descendant |
2000-2022 |
-21.4* (-24.3;-18.4) |
-21.4* (-24.3;-18.4) |
Pardo-Brazilians |
2000-2007 |
10.7* (5.2;21.1) |
3.7* (2.9;4.9) |
2007-2018 |
2.2* (1.0;14.9) |
||
2018-2022 |
-3.9 (-12.1;0.7) |
||
Indigenous |
2000-2022 |
-4.1* (-7.1;-0.8) |
-4.1* (-7.1;-0.8) |
Health Macro-region |
|
|
|
Litoral Leste/Jaguaribe |
2000-2022 |
0.8 (-0.3;2.0) |
0.8 (-0.3;2.0) |
Sertão Central |
2000-2008 |
8.3* (4.1;28.8) |
3.2* (1.8;5.1) |
2008-2022 |
0.4 (-3.1;1.9) |
||
Cariri |
2000-2019 |
1.8* (0.9;8.6) |
0.7 (-0.2;2.0) |
2019-2022 |
-6.0 (-16.3;1.3) |
||
Sobral |
2000-2022 |
1.6* (0.5;2.8) |
1.6* (0.5;2.8) |
Fortaleza |
2000-2022 |
1.6* (1.2;2.1) |
1.6* (1.2;2.1) |
Living in the capital |
|
|
|
No |
2000-2018 |
2.4* (1.9;3.3) |
1.3* (0.8;1.9) |
2018-2022 |
-3.3 (-10.2;0.4) |
||
Yes |
2000-2022 |
0.9* (0.4;1.6) |
0.9* (0.4;1.6) |
IBPª |
|
|
|
Very low |
- |
- |
- |
Low |
- |
- |
- |
Medium |
2000-2022 |
0.9* (0.4;1.5) |
0.9* (0.4;1.5) |
High |
2000-2018 |
4.0* (2.8;18.0) |
2.6* (1.3;5.0) |
2018-2022 |
-3.8 (-17.3;3.2) |
||
Very high |
2000-2018 |
2.1* (1.7;3.1) |
1.2* (0.6;1.7) |
2018-2022 |
-3.1 (-9.8;0.4) |
||
Size of municipality |
|
|
|
Small Size I |
2000-2022 |
1.6* (1.0;2.2) |
1.6* (1.0;2.2) |
Small Size II |
2000-2008 |
4.7* (2.0;19.1) |
1.8* (0.7;3.2) |
2008-2022 |
0.2 (-5.0;1.3) |
||
Medium Size |
2000-2016 |
3.2* (2.5;4.6) |
1.9* (1.2;2.6) |
2016-2022 |
-1.6 (-6.6;0.9) |
||
Large Size |
2000-2022 |
1.4* (0.8;2.0) |
1.4* (0.8;2.0) |
Captions: *Significantly different from 0 (p <0.05); 95% CI: 95% confidence intervals; APC: annual percent change; AAPC: average annual percent change; IBP: Brazilian Deprivation Index.
The geographical distribution of GC mortality rates adjusted for age and sex showed heterogeneity, with rising rates during the study period. High-risk areas (mortality rates ≥8.45/100,000 inhabitants) were significantly more common in the southern and western regions of the state, as well as in municipalities close to the capital (Figure 2).
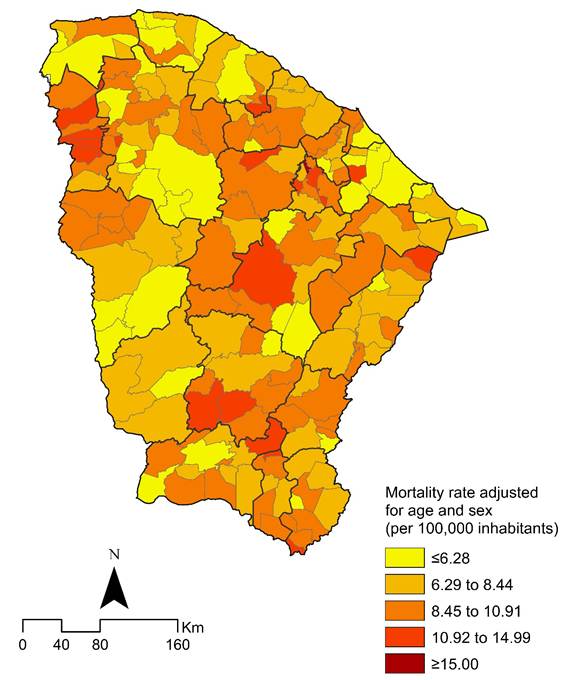
Figure 2. Distribution of age and sex-adjusted GC mortality rates (per 100,000 inhabitants), by municipality of residence in Ceará State, Brazil, 2000-2022
Source: The authors, based on SIM14 and IBGE17.
The LISA method identified municipalities with elevated mortality rates located near other municipalities with similarly elevated mortality rates in the period (Moran's I=0.142638, z-score=3.983685, p = 0.000068), with statistical significance. Spatial autocorrelation using the local Moran's index identified municipalities with a spatial correlation in the west, at the border with the state of Piauí, and in municipalities close to the capital (Figure 3).
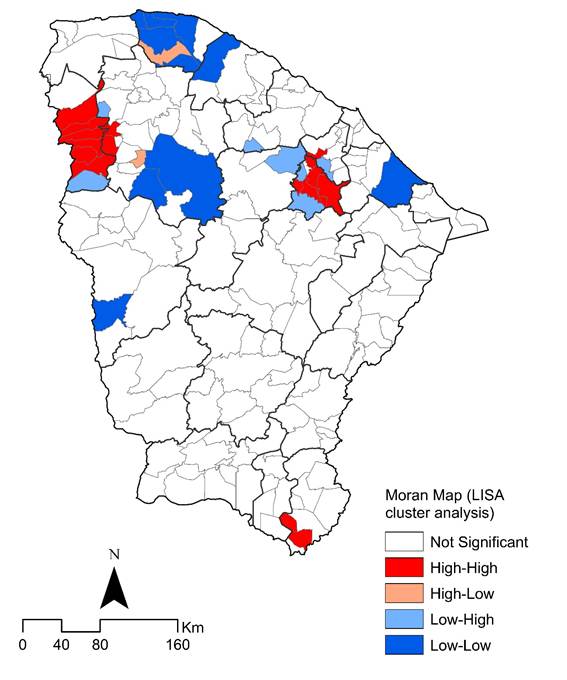
Figure 3. Spatial and spatiotemporal LISA cluster analysis (Moran map) of GC mortality rates (per 100,000 inhabitants) by municipality of residence in Ceará State, Brazil, 2000-2022
Source: The authors, based on SIM14 and IBGE17.
DISCUSSION
This is the first study to examine the spatial patterns and temporal trends of GC mortality over a 23-year period in 184 municipalities in Ceará. During the study period, the age- and sex-adjusted GC mortality rates demonstrated an upward trend across the entire state as well as in all health macro-regions, even in the context of the COVID-19 pandemic after 2020. Previous national studies evaluating GC mortality from 2000 to 2019 had already indicated that mortality rates in the state exhibited a rising rate that had not been consolidated. Operational issues related to access to timely diagnosis and appropriate treatment within SUS care network remain critical for improving GC detection24,25.
Higher GC mortality rates among individuals residing in large cities (>100,000 inhabitants) were observed, as well as in municipalities characterized by greater social vulnerability, lower educational attainment, and higher levels of poverty, as indicated by a high IBP index. Ceará is one of the northeastern states with the highest concentration of individuals without access to sanitation in 2022.
Social vulnerability is a recognized factor contributing to increased GC incidence and mortality worldwide1 and in Brazil26. The primary risk factor for distal GC, Helicobacter pylori infection, is associated with low economic development, poor sanitation, and limited educational attainment in most countries1,3. Previous studies conducted in the municipality of Fortaleza have demonstrated that the overall prevalence of H. pylori infection is high27, as is the prevalence of the more virulent CagA and VacA strains, which are significantly associated with GC28. Further research should be conducted to assess the prevalence of H. pylori infection throughout Ceará over recent decades. Indeed, controlling H. pylori infection could have a substantial impact on reducing both GC incidence and mortality29.
Furthermore, the limited availability and accessibility of health care resources for the early detection and treatment of GC as endoscopy, as well as the lack of GC screening guidelines for high-risk individuals within the Brazilian health care system may contribute to the higher GC mortality rates observed. This issue is particularly evident in disadvantaged areas as Ceará8. Population-based screening using upper gastrointestinal endoscopy has been shown to reduce GC mortality significantly in high-risk East Asian countries, including Japan and Korea5. The criteria for GC screening are determined by population risk, regional incidence, and individual risk factors. Accordingly, population-based screening is recommended in high-risk countries30.
A high-risk country is defined as one where the age-standardized incidence rate of GC is 10–12 cases or greater per 100,000 individuals per year, which usually mirrors the GC mortality rate. Additional criteria include a high prevalence of Helicobacter pylori infection, which is a well-established risk factor, along with the presence of other contributing factors. In regions with low incidence, population-wide screening is generally not cost-effective. Instead, screening efforts focus on individuals at increased risk, identified by factors as age, ethnicity, first degree history of GC, hereditary syndromes, premalignant gastric lesions, and Helicobacter pylori infection status30.
Another potential factor contributing to the observed increase in GC rates in Ceará is changes of dietary habits, including greater access to processed foods, high salt intake, and low intake of fresh vegetables and fruits31. Smoking is considered an important risk factor for GC32, although it has decreased in Brazil in recent decades, including the Northeast region33.
An increased risk of GC has been reported for some professional groups as agricultural workers, fishermen, and environmental exposures to coal, asbestos dust, organic solvents, pesticides and herbicides, nitrogen oxides, N-nitroso compounds, and ionizing radiation34. In Brazil, epidemiological studies suggest that agricultural workers have higher mortality rates by esophageal and stomach cancers than non-agricultural workers and that these disparities may be increasing35. As agribusiness has expanded in several regions of Brazil including Ceará36, it will be important to assess potential occupational exposures among agricultural workers in future studies.
Overall GC mortality and time-trend mortality rates were higher in males than in females. These findings are consistent with the literature1,26,36. One explanation is the higher incidence of GC in men, twice than in women1. In addition, men are more exposed to risk factors as tobacco, and alcohol use, and there are also biological differences as sex hormones and metabolic system37.
Most studies have shown that GC mortality increases significantly with age1,26,36,37. Similarly, in the present study, a higher percentage of GC was observed in the group aged 70 years or older. A temporal rising mortality trend was observed in men aged 45 years or younger, which is termed early-onset gastric cancer (EOGC)38. This finding has been reported in other Brazilian studies39,40, as well as in low-incidence countries as USA and United Kingdom41. The overall mortality rate of EOGC was 7.6%, similarly to previous studies performed in Fortaleza, Ceará39, and lower than in São Paulo (9%)40. The rates of EOGC vary between 2.7% and 15%, depending on the population studied41. The increase in EOGC is worrisome because several years of life are lost due to cancer-related disability or death41.
Increased GC mortality rates have been observed in Pardo-Brazilians (individuals with different ethnic ancestries). Similar results have been found in studies evaluating GC over time in Brazil36,42. There are few studies evaluating the association between racial inequality and GC in Brazilian public health system, however, the available data on GC disparities suggest that Black and Brown/Pardo populations face longer diagnostic delays, reduced access to specialized care, and worst prognoses40. Tackling this requires public health interventions and improved access to prevention and treatment in historically underserved populations.
However, no higher GC rates or temporal rising trend were found in indigenous populations. In contrast, increasing mortality among indigenous was observed in Siberians, the Mapuche in South America, the Inuit in the Arctic areas of Greenland, Canada and Alaska, the Māori in New Zealand43 and Amerindians in Brazil35. Furthermore, in Taiwan, New Zealand, United States, American Indians/Alaska Natives have been found to have a rising GC incidence and higher mortality rate compared to their non-Indigenous counterparts44.
The significant GC mortality in Ceará does not show a homogeneous distribution pattern among municipalities. High mortality rates (≥12.16/100,000 inhabitants) were more significant in the south of the state, in the macro-region of Cariri, and in the north, near the city of Sobral. From this perspective, in the period 2000-2017, municipalities with high mortality rates were identified, surrounded by other municipalities with similarly high mortality rates, with no statistical significance in the period 2018-2022. In addition, municipalities with a spatial correlation were identified in the south of the state until 2011, in the northwest from 2006-2017, and in municipalities near the capital since 2012. These areas share not only a process of historical organization of their space based on social and economic dimensions, but also the structuring of local health systems45.
Differences in the quality of mortality surveillance among municipalities in Ceará may have affected the results, especially in less developed municipalities, which is one of the study limitations. Additionally, the lack of information on the topographic subsite of GC does not allow the classification of GC as proximal (cardia) or distal (non-cardia).
Despite these limitations, one of the strengths of the study was the use of a nationwide database, and multiple causes of death, which included all death certificates referencing GC in any field. This approach is more accurate than the underlying causes of death.
CONCLUSION
In summary, GC mortality has shown a rising pattern for the state over the 23-year period analyzed. Relevant high-risk areas with a higher concentration of GC mortality were identified for future integrated actions to strengthen care, surveillance, and control networks.
GC represents a public health problem in the state, especially in younger than 45 years of age. The results reinforce the need for prevention strategies to be implemented to reduce future deaths for this population, as well as in high mortality areas.
ACKNOWLEDGEMENTS
Programa de Apoio à Pós-Graduação (PROAP) of the Coordination for Improvement of the High Level Personnel, (CAPES), Fundação Cearense de Apoio ao Desenvolvimento Científico e Tecnológico (FUNCAP) and National Council for Scientific and Technological Development (CNPq).
CONTRIBUTIONS
Lucia Libanez Bessa Campelo Braga, Helio De Almeida Nobre Junior, Anderson Fuentes Ferreira, and Alberto Novaes Ramos Jr. contributed to the study design, data analysis and interpretation, writing, and critical review of the intellectual content. Ana Suzete Lopes, Jorg Heukelbach, Edson Luiz de Oliveira, Vitor de Sousa Tomé, Daniele Calheiros Campelo Maia, and Taynara Lais Silva collaborated to the data analysis and interpretation, writing, and critical review of the intellectual content. All the authors approved the final version for publication.
DECLARATION OF CONFLICT OF INTERESTS
There is no conflict of interests to declare.
DATA AVAILABILITY STATEMENT
The dataset generated and reviewed during the study are available at the repository of DATASUS https://datasus.saude.gov.br/transferencia-de-arquivos/and ftp://ftp.datasus.gov.br/dissemin/publicos/SIM/CID10/DORES/
FUNDING SOURCES
None.
REFERENCES
1. Sung H, Ferlay J, Siegel RL, et al. Global cancer statistics 2022: GLOBOCAN estimates ofincidence and mortality worldwide for 36 cancers in 185countries. CA Cancer J Clin. 2024;74(3):205-313. doi: https://doi.org/10.3322/caac.21834
2. Morgan E, Arnold M, Camargo MC, et al. The current and future incidence and mortality of gastric cancer in 185 countries, 2020-40: a population-based modelling study. EClinicalMedicine. 2022;47:101404. doi: https://doi.org/10.1016/j.eclinm.2022.101404
3. Shirani M, Pakzad R, Haddadi MH, et al. The global prevalence of gastric cancer in Helicobacter pylori-infected individuals: a systematic review and meta-analysis. BMC Infect Dis. 2023;23(1):543. doi: https://doi.org/10.1186/s12879-023-08504-5
4. Suh YS, Yang HK. Screening and early detection of gastric cancer: east versus West. Surg Clin North Am. 2015;95(5):1053-66. doi: https://doi.org/10.1016/j.suc.2015.05.012
5. Luu XQ, Lee K, Jun JK, et al. Effect of gastric cancer screening on long-term survival of gastric cancer patients: results of Korean national cancer screening program. J Gastroenterol. 2022;57(7):464-75. doi: https://doi.org/10.1007/s00535-022-01878-4
6. Instituto Nacional de Câncer. Estimativa 2023: incidência de câncer no Brasil. Rio de Janeiro: INCA; 2022.
7. Santos MO, Lima FCS, Martins LFL, et al. Estimativa de incidência de câncer no Brasil, 2023-2025. Rev. Bras. Cancerol. 2023;69(1):e-213700. doi: https://doi.org/10.32635/2176-9745.RBC.2023v69n1.3700
8. Farias SH, Maia Neto WL, Tomaz KP, et al. Are the temporal trends of stomach cancer mortality in brazil similar to the low, middle, and high-income countries? Front Public Health. 2021;9:677012. doi: https://doi.org/10.3389/fpubh.2021.677012
9. Braga LLBC, Ferreira AF, Pinheiro FAS, et al. Temporal trends and spatial clusters of gastric cancer mortality in Brazil. Rev Panam Salud Publica. 2022;46:e101. doi: https://doi.org/10.26633/RPSP.2022.101
10. Diórgenes MSG, Min Y, Silva AR, et al. Mortalidade por câncer de estômago em Fortaleza-CE, Brasil: uma análise epidemiológica 2008-2017. Braz J Surg Clin Res. 2020;31(3):13-7.
11. Instituto Brasileiro de Geografia e Estatística [Internet]. Rio de Janeiro: IBGE; 2025. Malha Municipal. [acesso 2025 jan 5]. Disponível em: https://www.ibge.gov.br/geociencias/organizacao-do-territorio/malhas-territoriais/15774-malhas.html
12. TABNET [Internet]. Mortalidade. Brasília (DF): DATASUS. c2008. [acesso 2025 maio 28]. Disponível em: https://datasus.saude.gov.br/informacoes-de-saude-tabnet/
13. Organização Mundial da Saúde. CID-10: Classificação Estatística Internacional de Doenças e problemas relacionados à saúde. São Paulo: Edusp; 2008.
14. TABNET [Internet]. População residente. Brasília (DF): DATASUS. c2008. [acesso 2025 maio 28]. Disponível em: https://datasus.saude.gov.br/populacao-residente
15. TabWin [Internet]. Versão 4.15. Brasília (DF): DATASUS. c2008. [acesso 2025 maio 28]. Disponível em: http://www2.datasus.gov.br/DATASUS/index.php?area=060805&item=2
16. StataR [Internet]. Versão 11.2. Lakeway: StataCorp LLC; 1996-2024c. [acesso 2023 nov 20]. Disponível em: https://www.stata.com/
17. Sinopse do Censo 2010 [Internet]. Rio de Janeiro: IBGE; [2011]. [acesso 2022 fev 11]. Disponível em: https://censo2010.ibge.gov.br/sinopse/index.php?dados=12
18. Allik M, Ramos D, Agranonik M, et al. Developing a small-area deprivation measure for Brazil: technical report. Glasgow: University of Glasgow; 2020. doi: https://doi.org/10.5525/gla.researchdata.980
19. Kim H-J, Fay MP, Feuer EJ, et al. Permutation tests for joipoint regression with applications to cancer rates. Stat Med. 2000;19(3):335-51. doi: https://doi.org/10.1002/(sici)1097-0258(20000215)19:3%3C335::aid-sim336%3E3.0.co;2-z
20. Joinpoint Regression Program [Internet]. Version 5.0.0. 2024. Hoboken: John Wiley & Sons, Ltd; c2000. [acessado 2024 abr 22]. Disponível em: https://surveillance.cancer.gov/joinpoint/
21. Assunção RM, Barreto SM, Guerra HL, et al. Mapas de taxas epidemiológicas: uma abordagem Bayesiana. Cad Saude Publica. 1998;14(4):713-23. doi: https://doi.org/10.1590/s0102-311x1998000400013
22. ArcGIS [Internet]. Version 9.3. Redlands, CA: ESRI; 2008. [acessado 2024 abr 22]. Disponível em: https://www.esri.com/en-us/arcgis/products/index
23. Conselho Nacional de Saúde (BR). Resolução n° 510, de 7 de abril de 2016. Dispõe sobre as normas aplicáveis a pesquisas em Ciências Humanas e Sociais cujos procedimentos metodológicos envolvam a utilização de dados diretamente obtidos com os participantes ou de informações identificáveis ou que possam acarretar riscos maiores do que os existentes na vida cotidiana, na forma definida nesta Resolução [Internet]. Diário Oficial da União, Brasília, DF. 2016 maio 24 [acesso 2025 abr 7]; Seção 1:44. Disponível em: http://bvsms.saude.gov.br/bvs/saudelegis/cns/2016/res0510_07_04_2016.html
24. Ministério da Saúde (BR). Diretrizes diagnósticas e terapêuticas: adenocarcinoma de estômago. Brasília, DF: CONITEC SUS; 2017.
25. Instituto Trata Brasil. Ranking do Saneamento [Internet]. São Paulo: GO associados; 2022. [acessado 2024 abr 22]. Disponível em: https://tratabrasil.org.br/wp-content/uploads/2022/09/Relatorio_do_RS_2022.pdf
26. Oliveira AE, Fernandes GA, Silva DRM, et al. The impact of the human development index on stomach cancer incidence in Brazil. Ecancermedicalscience. 2023;17:1552. doi: https://doi.org/10.3332/ecancer.2023.1552
27. Rodrigues MN, Queiroz DM, Rodrigues RT, et al. Helicobacter pylori infection in adults from a poor urban community in northeastern Brazil: demographic, lifestyle and environmental factors. Braz J Infect Dis. 2005;9(5):405-10. doi: https://doi.org/10.1590/s1413-86702005000500008
28. Cavalcante MQF, Silva CIS, Braga-Neto MB, et al. Helicobacter pylori vacA and cagA genotypes in patients from northeastern Brazil with upper gastrointestinal diseases. Mem Inst Oswaldo Cruz. 2012;107(4):561-3. doi: https://doi.org/10.1590/S0074-02762012000400021
29. Riquelme A, Abnet CC, Goodman KJ, et al. Recommendations for gastric cancer prevention and control in the Americas. Lancet Reg Health Am. 2023;27:100608. doi: https://doi.org/10.1016/j.lana.2023.100608
30. Quach DT, Hiyama T, Gotoda T. Identifying high-risk individuals for gastric cancer surveillance from western and eastern perspectives: lessons to learn and possibility to develop an integrated approach for daily practice. World J Gastroenterol. 2019;25(27):3546-62. doi: https://doi.org/10.3748/wjg.v25.i27.3546
31. Poorolajal J, Moradi L, Mohammadi Y, et al. Risk factors for stomach cancer: a systematic review and meta-analysis. Epidemiol Health. 2020;42:e2020004. doi: https://doi.org/10.4178/epih.e2020004
32. Wünsch Filho V, Mirra AP, López RVM, et al. Tabagismo e câncer no Brasil: evidências e perspectivas. Rev bras epidemiol. 2010;13(2):175-87. doi: https://doi.org/10.1590/S1415-790X2010000200001
33. Shah SC, Boffetta P, Johnson KC, et al. Occupational exposures and odds of gastric cancer: a StoP project consortium pooled analysis. Int J Epidemiol. 2020;49(2):422-34. doi: https://doi.org/10.1590/S1415-790X2010000200001
34. Krawczyk N, Santos ASE, Lima J, et al. Revisiting cancer 15 years later: Exploring mortality among agricultural and non-agricultural workers in the Serrana Region of Rio de Janeiro. Am J Ind Med. 2017;60(1):77-86. doi: https://doi.org/10.1002/ajim.22660
35. Ferreira MJM, Viana Júnior MM. A expansão do agronegócio no semiárido cearense e suas implicações para a saúde, o trabalho e o ambiente. Interface (Botucatu). 2016;20(58):649-60. doi: https://doi.org/10.1590/1807-57622015.0029
36. Braga LLBC, Ramos Jr. AN, Braga Neto MB, et al. Unequal burden of mortality from gastric cancer in Brazil and its regions, 2000-2015. Gastric Cancer. 2019;22(4):675-683. doi: https://doi.org/10.1007/s10120-018-00916-6
37. Lou L, Wang L, Zhang Y, et al. Sex difference in incidence of gastric cancer: an international comparative study based on the Global Burden of Disease Study 2017. BMJ Open. 2020;10(1):e033323. doi: https://doi.org/10.1136/bmjopen-2019-033323
38. Arnold M, Park JY, Camargo MC, et al. Is gastric cancer becoming a rare disease? A global assessment of predicted incidence trends to 2035. Gut. 2020;69(5):823-9. doi: https://doi.org/10.1136/gutjnl-2019-320234
39. Braga-Neto MB, Carneiro JG, Castro Barbosa AM, et al. Clinical characteristics of distal gastric cancer in young adults from Northeastern Brazil. BMC Cancer. 2018;18(1):131. doi: https://doi.org/10.1186/s12885-018-3995-4
40. Ramos MFKP, Pereira MA, Sagae VMT, et al. Gastric cancer in young adults: a worse prognosis group? Rev Col Bras Cir. 2019;46(4):e20192256. doi: https://doi.org/10.1590/0100-6991e-20192256
41. Milne AN, Offerhaus GJ. Early-onset gastric cancer: learning lessons from the young. World J Gastrointest Oncol. 2010;2(2):59-64. doi: https://doi.org/10.4251/wjgo.v2.i2.59
42. Meira KC, Guimarães RM, Guimarães NS. Temporal trends in stomach and colorectal cancer mortality by racial groups in Brazil (2000-2023): a longitudinal ecological study. Intern J Envir Res and Public Health. 2025;22(2):208. doi: https://doi.org/10.3390/ijerph22020208
43. Arnold M, Moore SP, Hassler S, et al. The burden of stomach cancer in indigenous populations: a systematic review and global assessment. Gut. 2014;63(1):64-71. doi: https://doi.org/10.1136/gutjnl-2013-305033
44. Cordova-Marks FM, Carson WO, Monetathchi A, et al. Native and indigenous populations and gastric cancer: a worldwide review. Int J Environ Res Public Health. 2022;19(9):5437-50 doi: https://doi.org/10.3390/ijerph19095437
45. Guerra MR, Bustamante-Teixeira MT, Corrêa CSL, et al. Magnitude and variation of the burden of cancer mortality in Brazil and Federation Units, 1990 and 2015. Rev Bras Epidemiol. 2017;20(Suppl 1):102-15. doi: https://doi.org/10.1590/1980-5497201700050009 Erratum: Rev Bras Epidemiol. 2019;22:e190009ERRATUM. doi: https://doi.org/10.1590/1980-5497201700050009erratum
Recebido em 7/5/2025
Aprovado em 3/7/2025
Scientific-editor: Anke Bergmann. Orcid iD: https://orcid.org/0000-0002-1972-8777
![]()
Este é um artigo publicado em acesso aberto (Open Access) sob a licença Creative Commons Attribution, que permite uso, distribuição e reprodução em qualquer meio, sem restrições, desde que o trabalho original seja corretamente citado.